COVIDAMP.ORG: A Global Resource for Governance in the Time of COVID
Jul 16, 2020
Dr. Rebecca Katz and Dr. Ellie Graeden
Countries, states, and local governments have been implementing policies since January 2020 to try to reduce the spread and impact of COVID19 in their communities. Decision makers have been and continue working to find the appropriate policy measures to implement in their community as conditions change, but need access to a user-friendly, current, integrated source of information to define their policy options as the event progresses, assess how effective those policy decisions have been, and evaluate next steps for managing the pandemic.
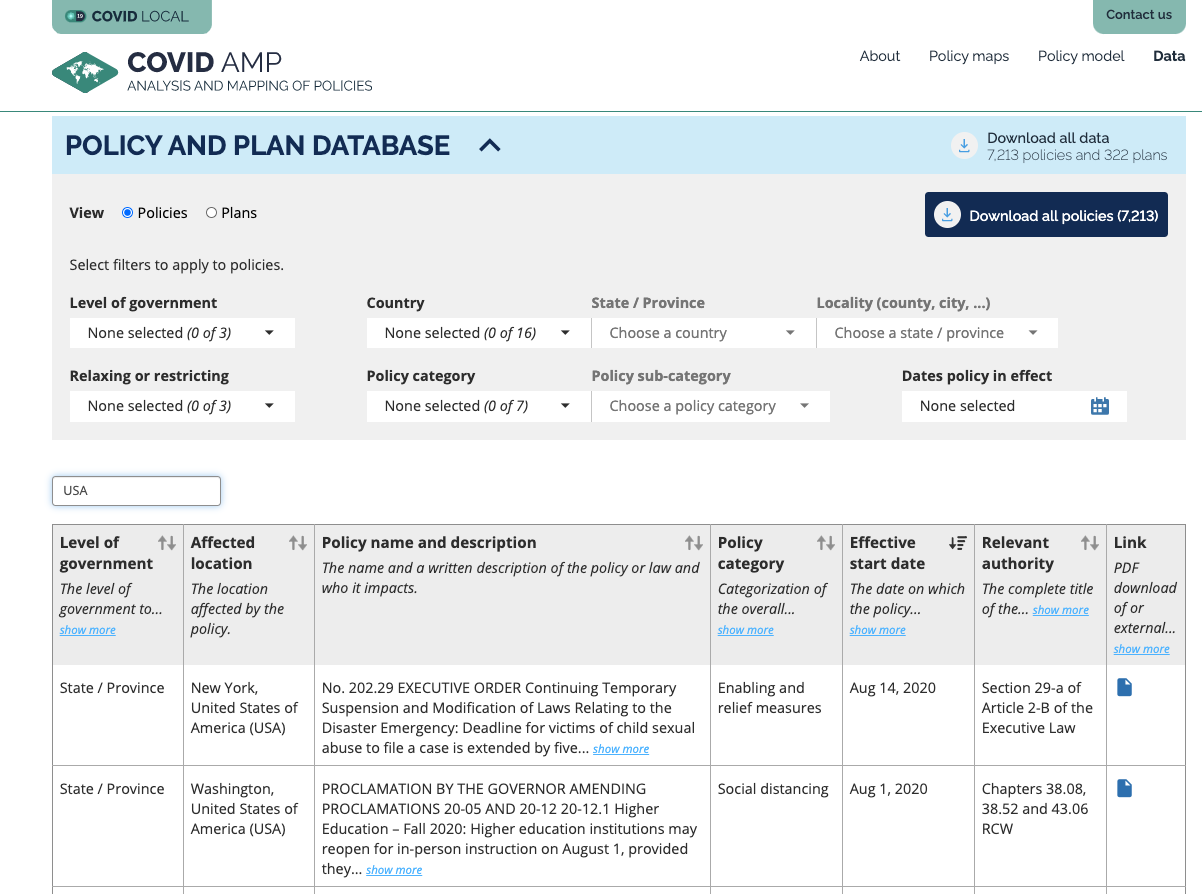
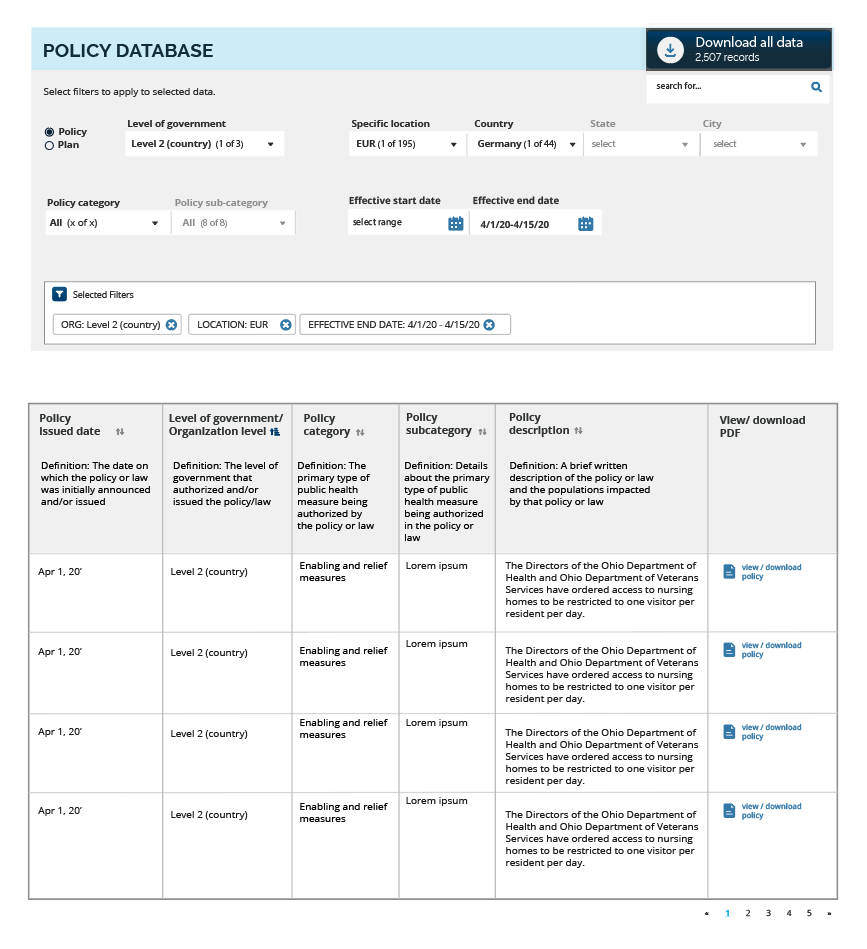
Figure 1: The COVID AMP policy data are fully searchable and accessible online.
Decision makers need an evidence base to assess which policy decisions help control disease and which policy decisions exacerbate the outbreak. At the minimum, they need to understand which policies correlate with success. Ideally, they want to know what will make a difference.
To build this evidence base, the research team at the Georgetown University Center for Global Health Science and Security, in close collaboration with the research and development team at Talus Analytics, has collated a detailed repository of the policies implemented at the international, national, state, and county level to respond to COVID-19, including timelines and the associated legal authorities on which they draw. This dataset is the result of an on-going, large-scale data collection effort designed to capture policies as they are implemented, in recognition that many such policies may be short term or be quickly overturned and lost to the historical record.
This platform is COVID AMP: COVID Analysis and Mapping of Policies, available online at (COVID-LOCAL.org/AMP) website. With every new development, we capture the key actions in our dataset, visualized and accessible through a web-based tool, from mandating masks to local policies against using tear gas at protests intended to reduce disease transmission.
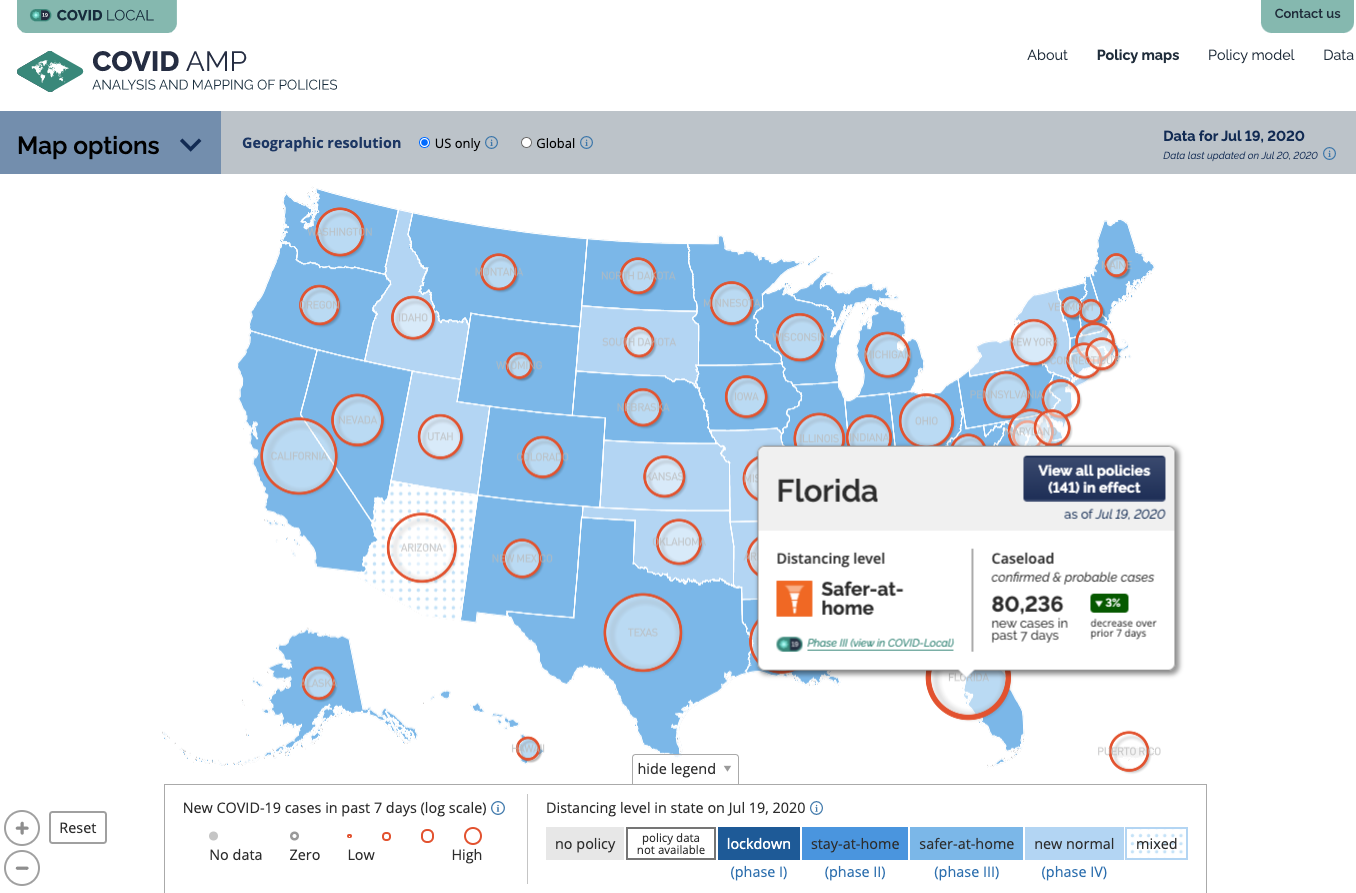
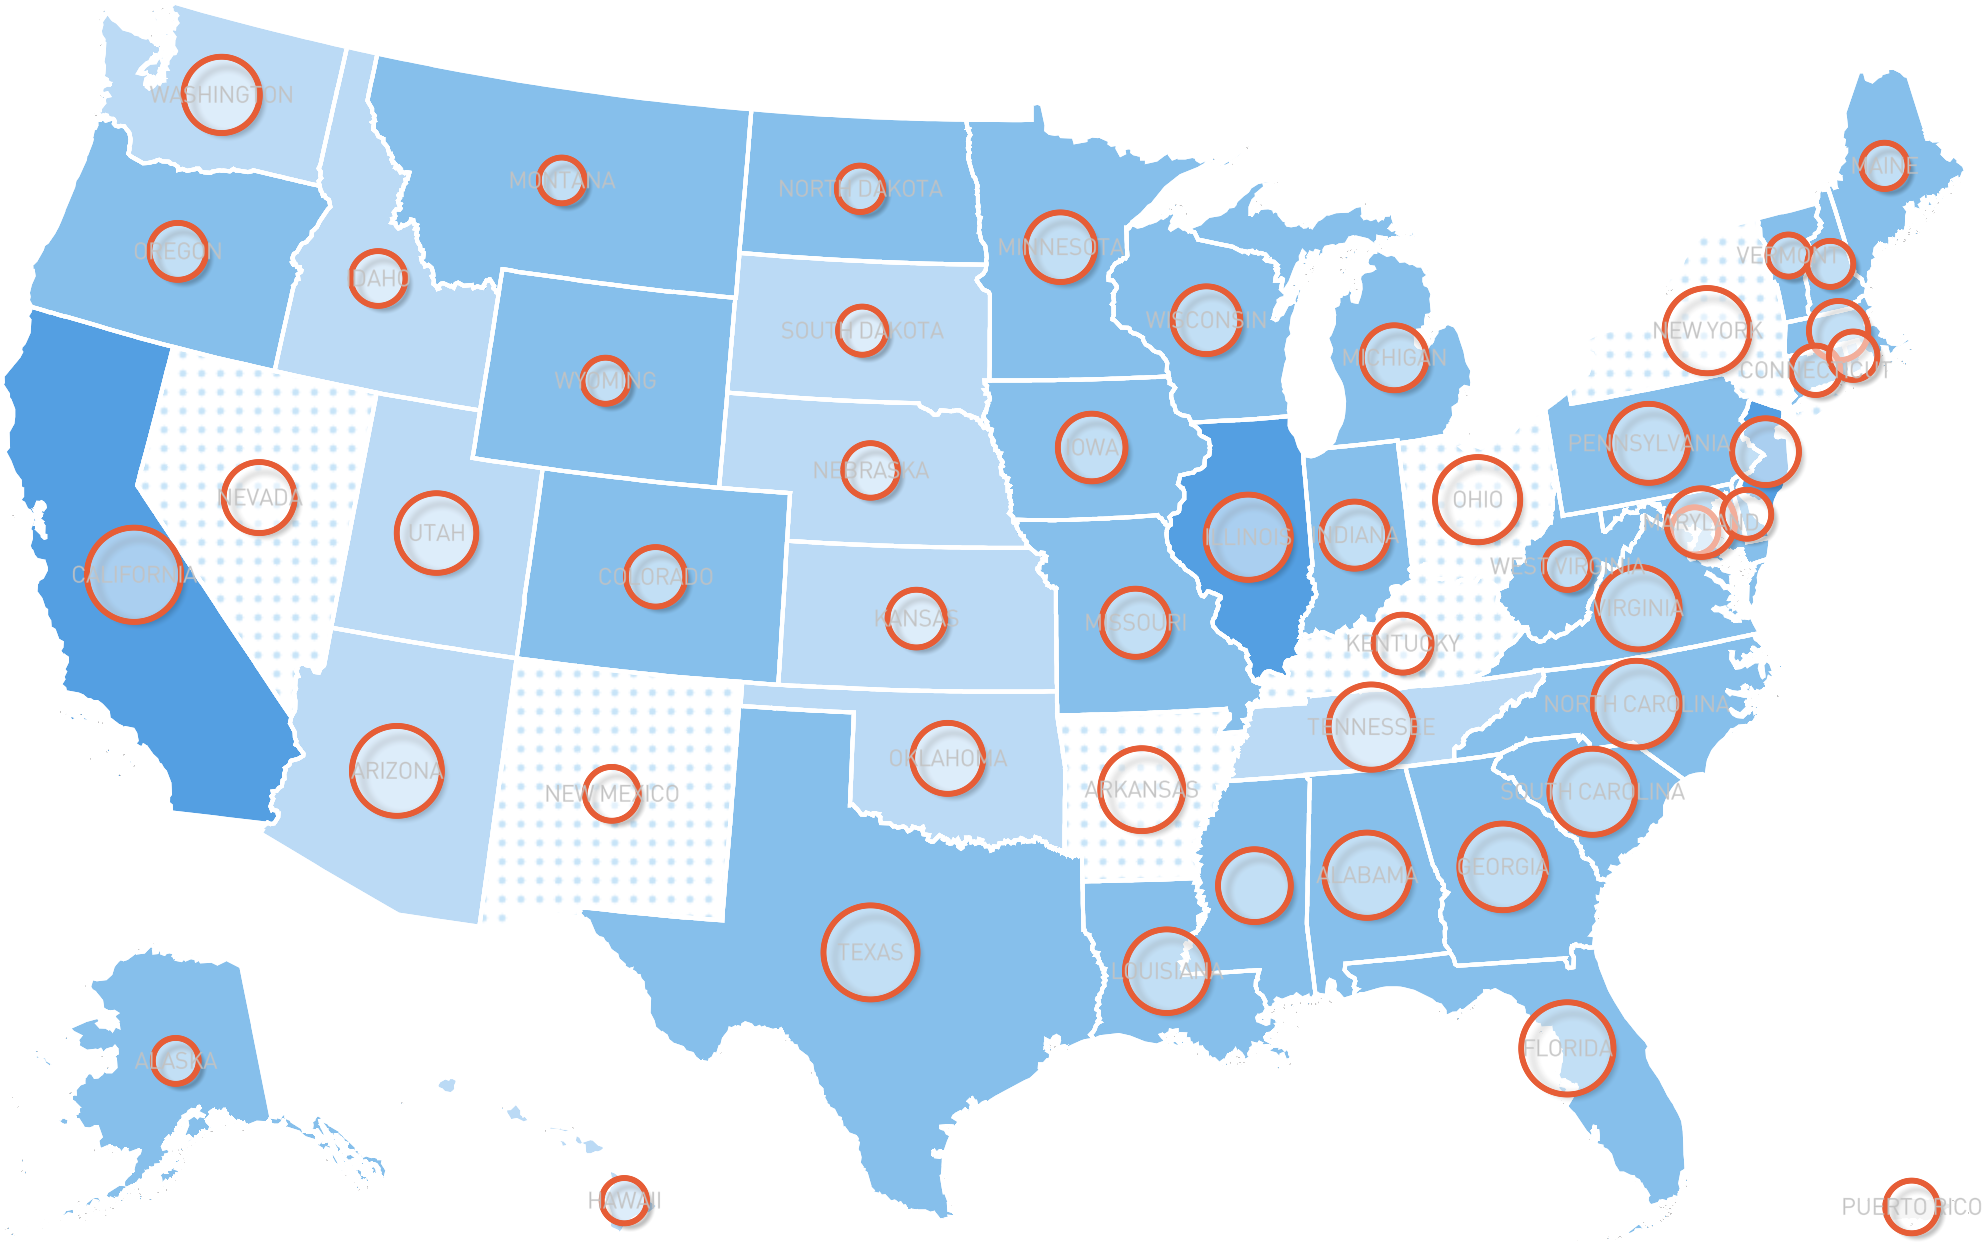
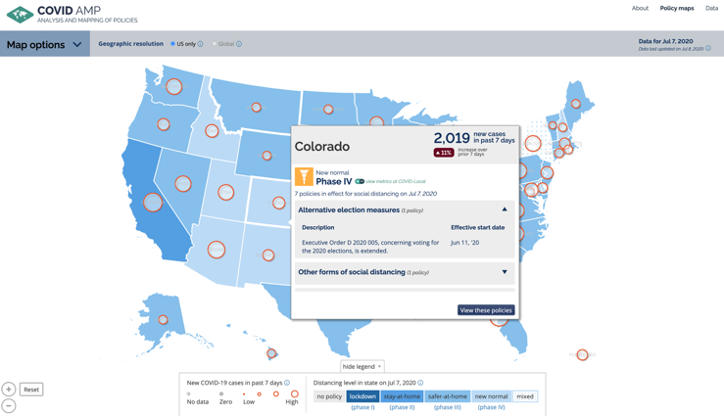
Figure 2: COVID AMP supports geographic analysis of which policies or set of policies were in place and what at time over the course of the outbreak.
In parallel, we have developed a data pipeline and corresponding data visualizations to align the policies with real-time surveillance data for each US state, including the caseload and fatality data collected and made public by CDC, WHO, and others. We have designed the platform to support rigorous statistical analysis linking longitudinal policy implementation with the caseload, mobility metrics, and other data, to analyze relationships between policies and target outcomes. These efforts will be continuing in the coming months. In addition, we have built a predictive SEIR-based model that incorporates data on real-time status of the outbreak and historical actions and predicts the future trajectory of the outbreak in each location. Critically, this policy model and corresponding visualizations support counterfactual analysis, showing decision makers how caseload in their communities would have been different had they not acted when they did. The tool allows decision makers to tell their “good news” story, providing evidence of how their prior actions had an impact and a communications platform to tell that story in addition to informing future policy decisions and assessing relative impact as communities transition to different stages of re-opening or closing. The data repository, visualization and models allow decision makers to: 1. know what was implemented where, when, and under what authority, 2. make the case for the value the policies they have already been implemented, and 3. develop the global evidence base for what types of measures are most appropriate and successful in mitigating the pandemic.
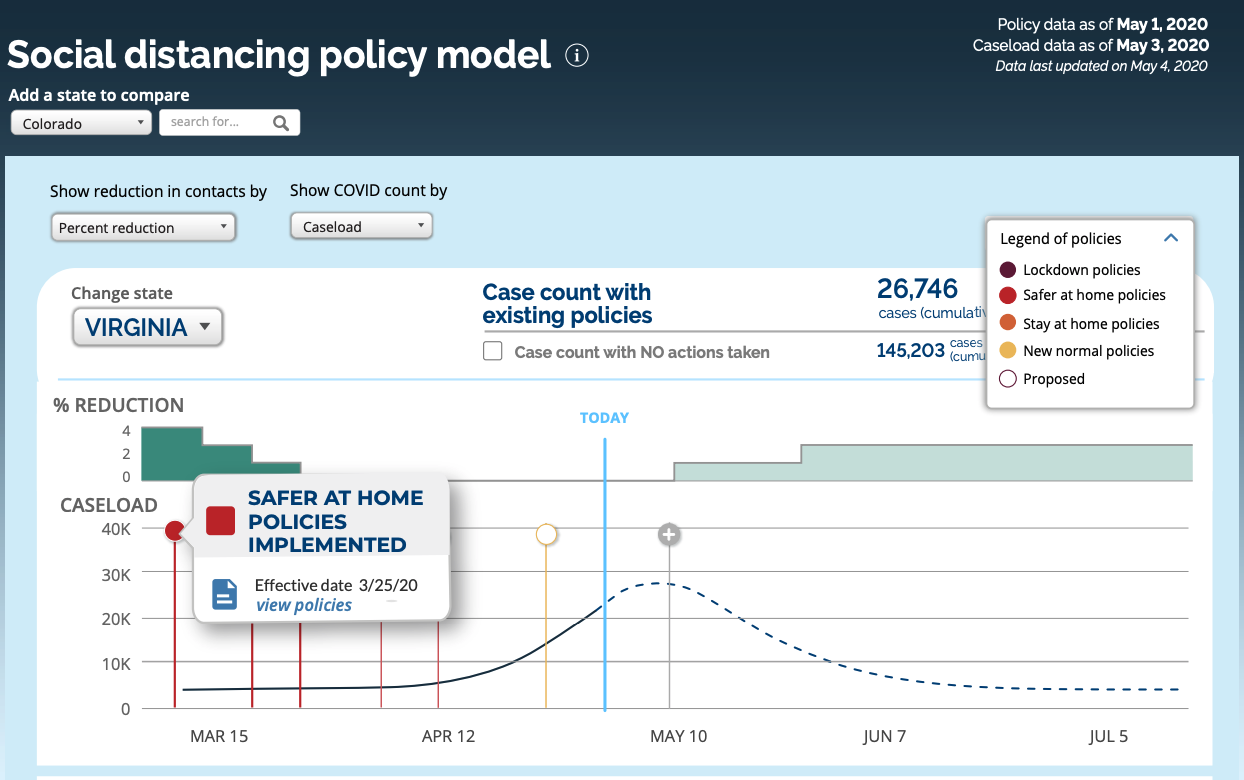
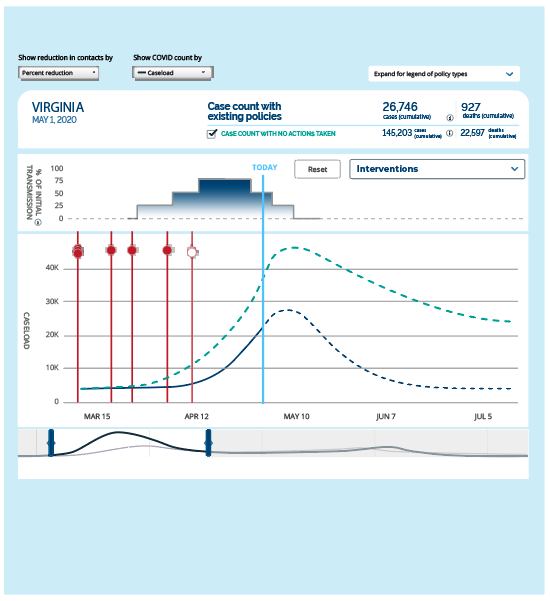
Figure 3: The COVID AMP policy model allows interactive analysis of how policy implementation relates to caseload over time.
While a major lynchpin in helping inform the current response, this platform is a critical tool for helping guide governments and response efforts for the outbreak as it continues and for future outbreaks and pandemics. COVID AMP includes not only those elements needed for COVID-19, but is designed to serve as a long-term research and analysis tool, allowing us to capture and build upon what we learn now, enhancing pandemic preparedness and response readiness for the future. We welcome feedback and recommendations for other data sources or ways to improve our analysis. We are happy to help support your work through direct APIs for data transfer or other collaborations. Please contact us at: (outbreak@georgetown.edu).
Research Team
COVID AMP is a joint research effort by Georgetown University Center for Global Health Science and Security and Talus Analytics, LLC, working in partnership with NTI Bio and the COVID-LOCAL.org team. This effort is supported by a tireless research team, including:
[IMAGE]