Metrics for Phased Reopening

Contact us

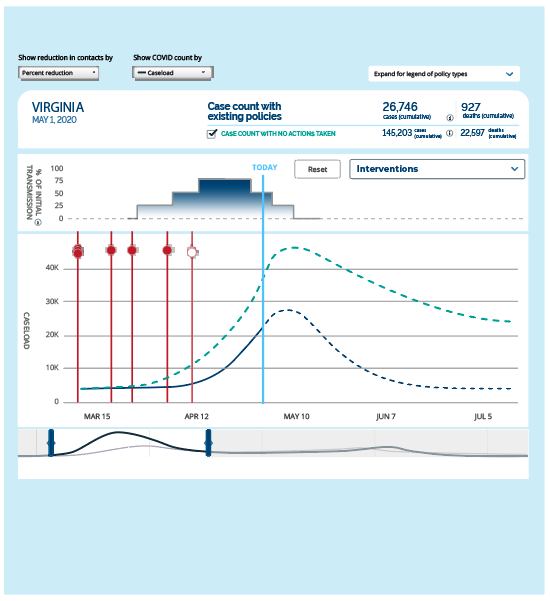
Local leaders across the United States have been working to bolster public health capacity and reopen and stay open safely — protecting their communities from the disease and supporting economic recovery and growth. COVID-Local provides decision-makers with easy-to-use metrics for a phased re-opening strategy. These metrics can be used to assess current response, pinpoint areas for action, and make decisions for moving to the next phase of re-opening.

  • Metrics Overview Describes phases and key metrics associated with each phase under a set of public health categories.
  • Scorecard Shows how to self-assess your community’s progress across all metrics for each Phase.
  • Assess Your Progress Offers an interactive checklist to be used to show progress toward meeting thresholds for each phase.
Lockdown1432PHASES FOR RE-OPENINGPhase 4: New normal • Maximal return to normalcy that is viable prior to herd immunity via widespread vaccination• Community transmission is well monitored and virus flare-ups are contained rapidly • Most high-risk/low criticality functions can resume Phase 3: Economic recovery • Widely re-opening economic and social functions once transmission has declined and is suppressed • Moderate-sized gatherings and activities in enclosed spaces possible with appropriate mitigation• Continue to prohibit large gatherings• Telework should continue wherever feasiblePhase 2: Initial re-opening • Limited number of critically important activities open• Continue to prohibit gatherings in enclosed spaces• Some outdoor activities with appropriate distancing • Telework should continue wherever feasiblePhase 1: Maximum social-distancing Tailored to each community, focus is on reducing person-to-person transmission and decreasing the burden on the healthcare systemFULL PHASE DESCRIPTIONFULL PHASE DESCRIPTIONFULL PHASE DESCRIPTIONFULL PHASE DESCRIPTIONProtecting At-Risk PopulationsHealthcare ReadinessCase & Contact InvestigationsDiagnosticTesting & SurveillanceInfection RateCovidActNow LogoCovidActNow LogoCovidActNow LogoCurrent estimate of <1 caseper 100,000 population per day<1% positive of tests conducted (daily)Continued decline in daily cases<3% positive of tests conducted (daily)Current estimate of <10 casesper 100,000 population per daySustained decline in daily cases for 21 consecutive days, as reflected in the 5-day rolling average<10% positive of tests conducted (daily)Current estimate of <25 casesper 100,000 population per dayRates & New Cases DecreasingRates & New Cases Increasing
CovidActNow Logo

In addition to utilizing the metrics found in COVID Local, we recommend using COVID Act Now for data on your state or locality. Learn more on this blog post.

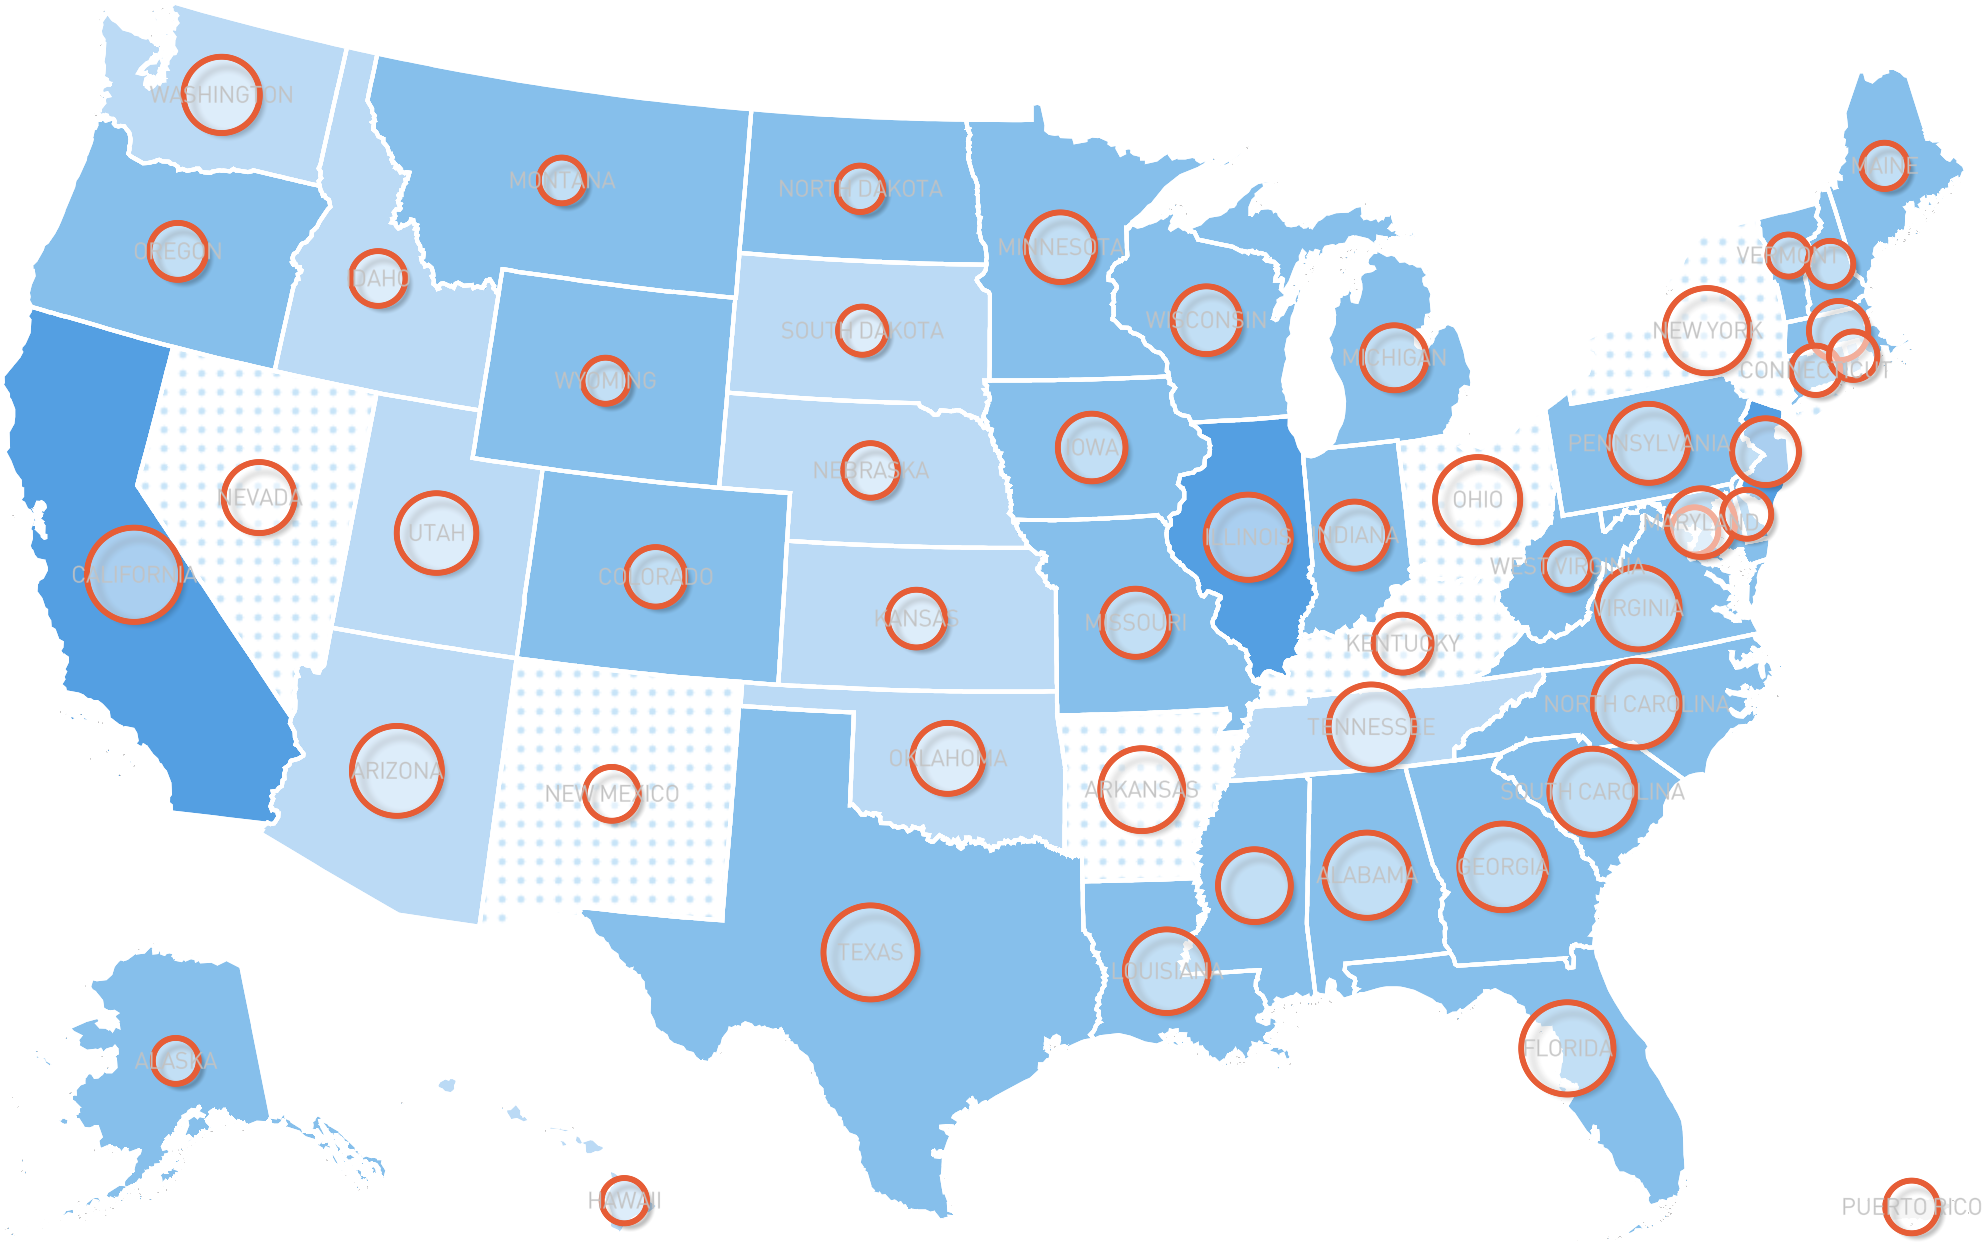
Visualizing the impact of policies on COVID response

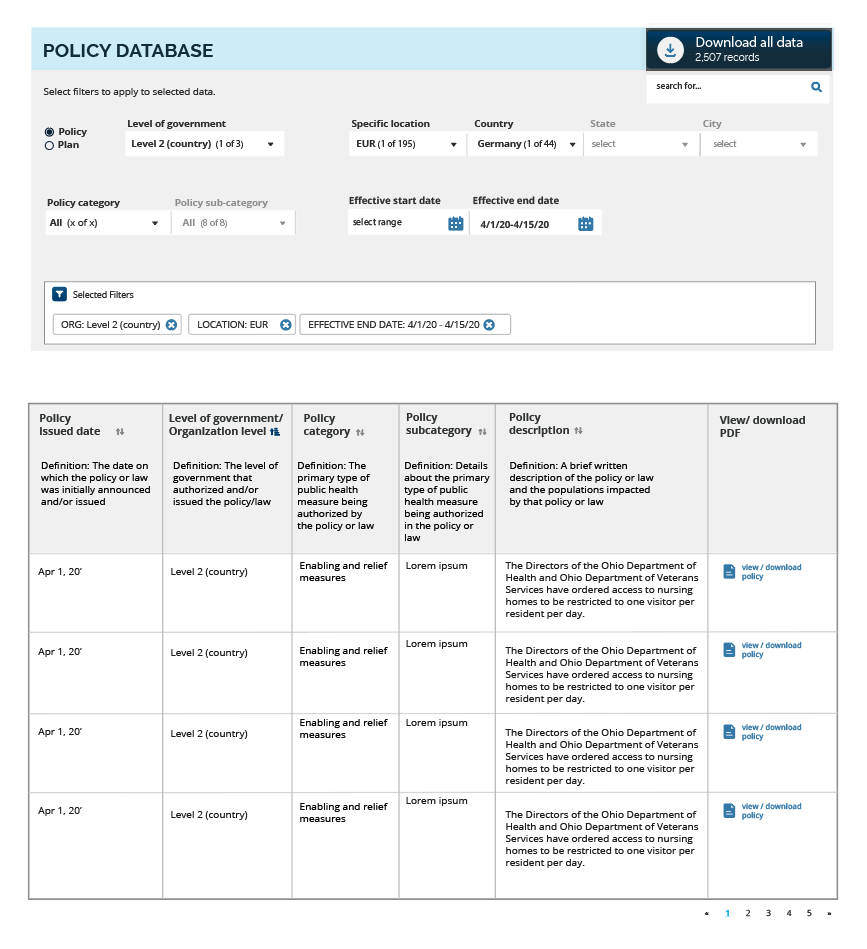
The COVID Analysis and Mapping of Policies (AMP) visualization tool is a comprehensive database of policies and plans to address the COVID-19 pandemic. Decision-makers can use COVID AMP’s user-friendly interface to easily identify effective policies and plans to reduce the impacts of the COVID-19 pandemic.